A simple plotting interface as a compositional tool
About 10 years ago I was using Common Music 3's plotting tool for designing and controlling parameters over time. Over the years commonmusic have not been updated and became kinda obsolete.
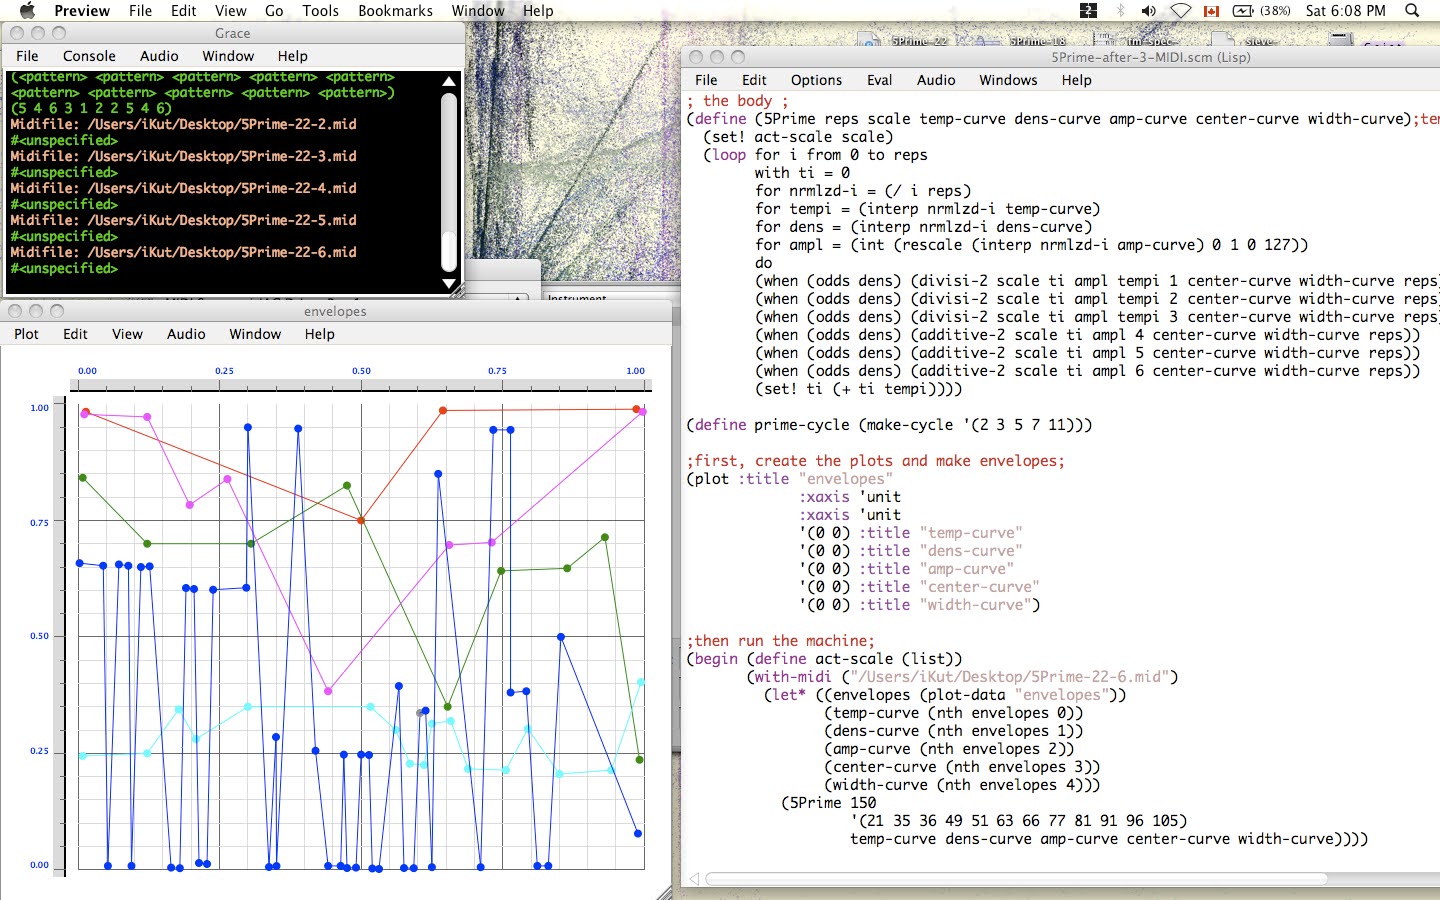
Since I personnaly prefer taking notes and making sketches with computer, I tried to make a cheap imitation of CM3's plotting tool using python's matplotlib module. One can plot up to 10 x-y pairs on a canvas, add&remove data points with mouse click and copy the data points (as x - y seperate lists) to clipboard. ctrl+r writes the plot to a file.
you need to have installed matplotlib and pyperclip modules beforehand
> pip3 install matplotlib pyperclip
and the run the source file.py with terminal
> python3 graphic_composition_tool.py
and give plot parameters as prompt response
to reopen a saved plot
> python3 graphic_composition_tool.py PLOT_date.plt
copy (ctrl+c) and paste datas to anywhere you are working
the source resides here: https://github.com/ayk-caglayan/graphic_composition_tool


Comments
Post a Comment